sort by:


![Mean discrimination accuracies obtained from the participants of Mitchell et al.'s research [26].](https://ndownloader.figshare.com/files/6749163/preview/6749163/thumb.png)
figure posted on 2015-04-30
![Item-wise confusion matrix from the participants of Mitchell et al.’s research [26].](https://s3-eu-west-1.amazonaws.com/ppreviews-plos-725668748/6749178/thumb.png)
figure posted on 2015-04-30
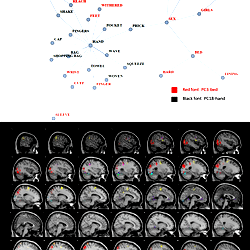
figure posted on 2015-04-30


dataset posted on 2014-10-24

dataset posted on 2014-10-24


dataset posted on 2014-10-24


figure posted on 2013-12-17


figure posted on 2013-12-17


figure posted on 2013-11-20


figure posted on 2013-10-10

figure posted on 2013-10-10

